How Big Is the Average American Home, State by State
When you picture the "average" American home, what comes to mind? A cozy bungalow, a spacious two-story, or perhaps a sprawling ranch? The truth is, there is no single standard for home size. While the national average hovers around 2,000 square feet, the size of the house you're likely to buy or live in depends dramatically on which state you call home. In some states, large single-family homes with big yards are the norm. In others, dense urban living, older housing stock, zoning rules, and limited buildable land mean much smaller average homes.
If you’re thinking about relocating, buying, or investing, or simply curious about how your space stacks up against the national landscape, then this article is for you. We’ll explore the average size of homes in the U.S., unpack why these differences exist, and look at how minimum house sizes have shifted over time.
What Is the Average Home Size in the U.S.?
Depending on the source, the average size of a newly-built single-family home in the U.S. today falls between about 2,100 and 2,200 square feet (with estimates varying between data providers like Federal Reserve Economic Data and the U.S. Census Bureau). These numbers represent a “median,” meaning half of the new homes are larger, and half are smaller.
However, national figures can be misleading. They blend the sprawling suburban houses common in states like Texas with the more compact homes typical of the Northeast, where land is scarce and zoning rules limit size. To really understand home size, you need to zoom in to the state (and sometimes even the metro) level, where local conditions shape what “average” looks like.
Average Home Size by State
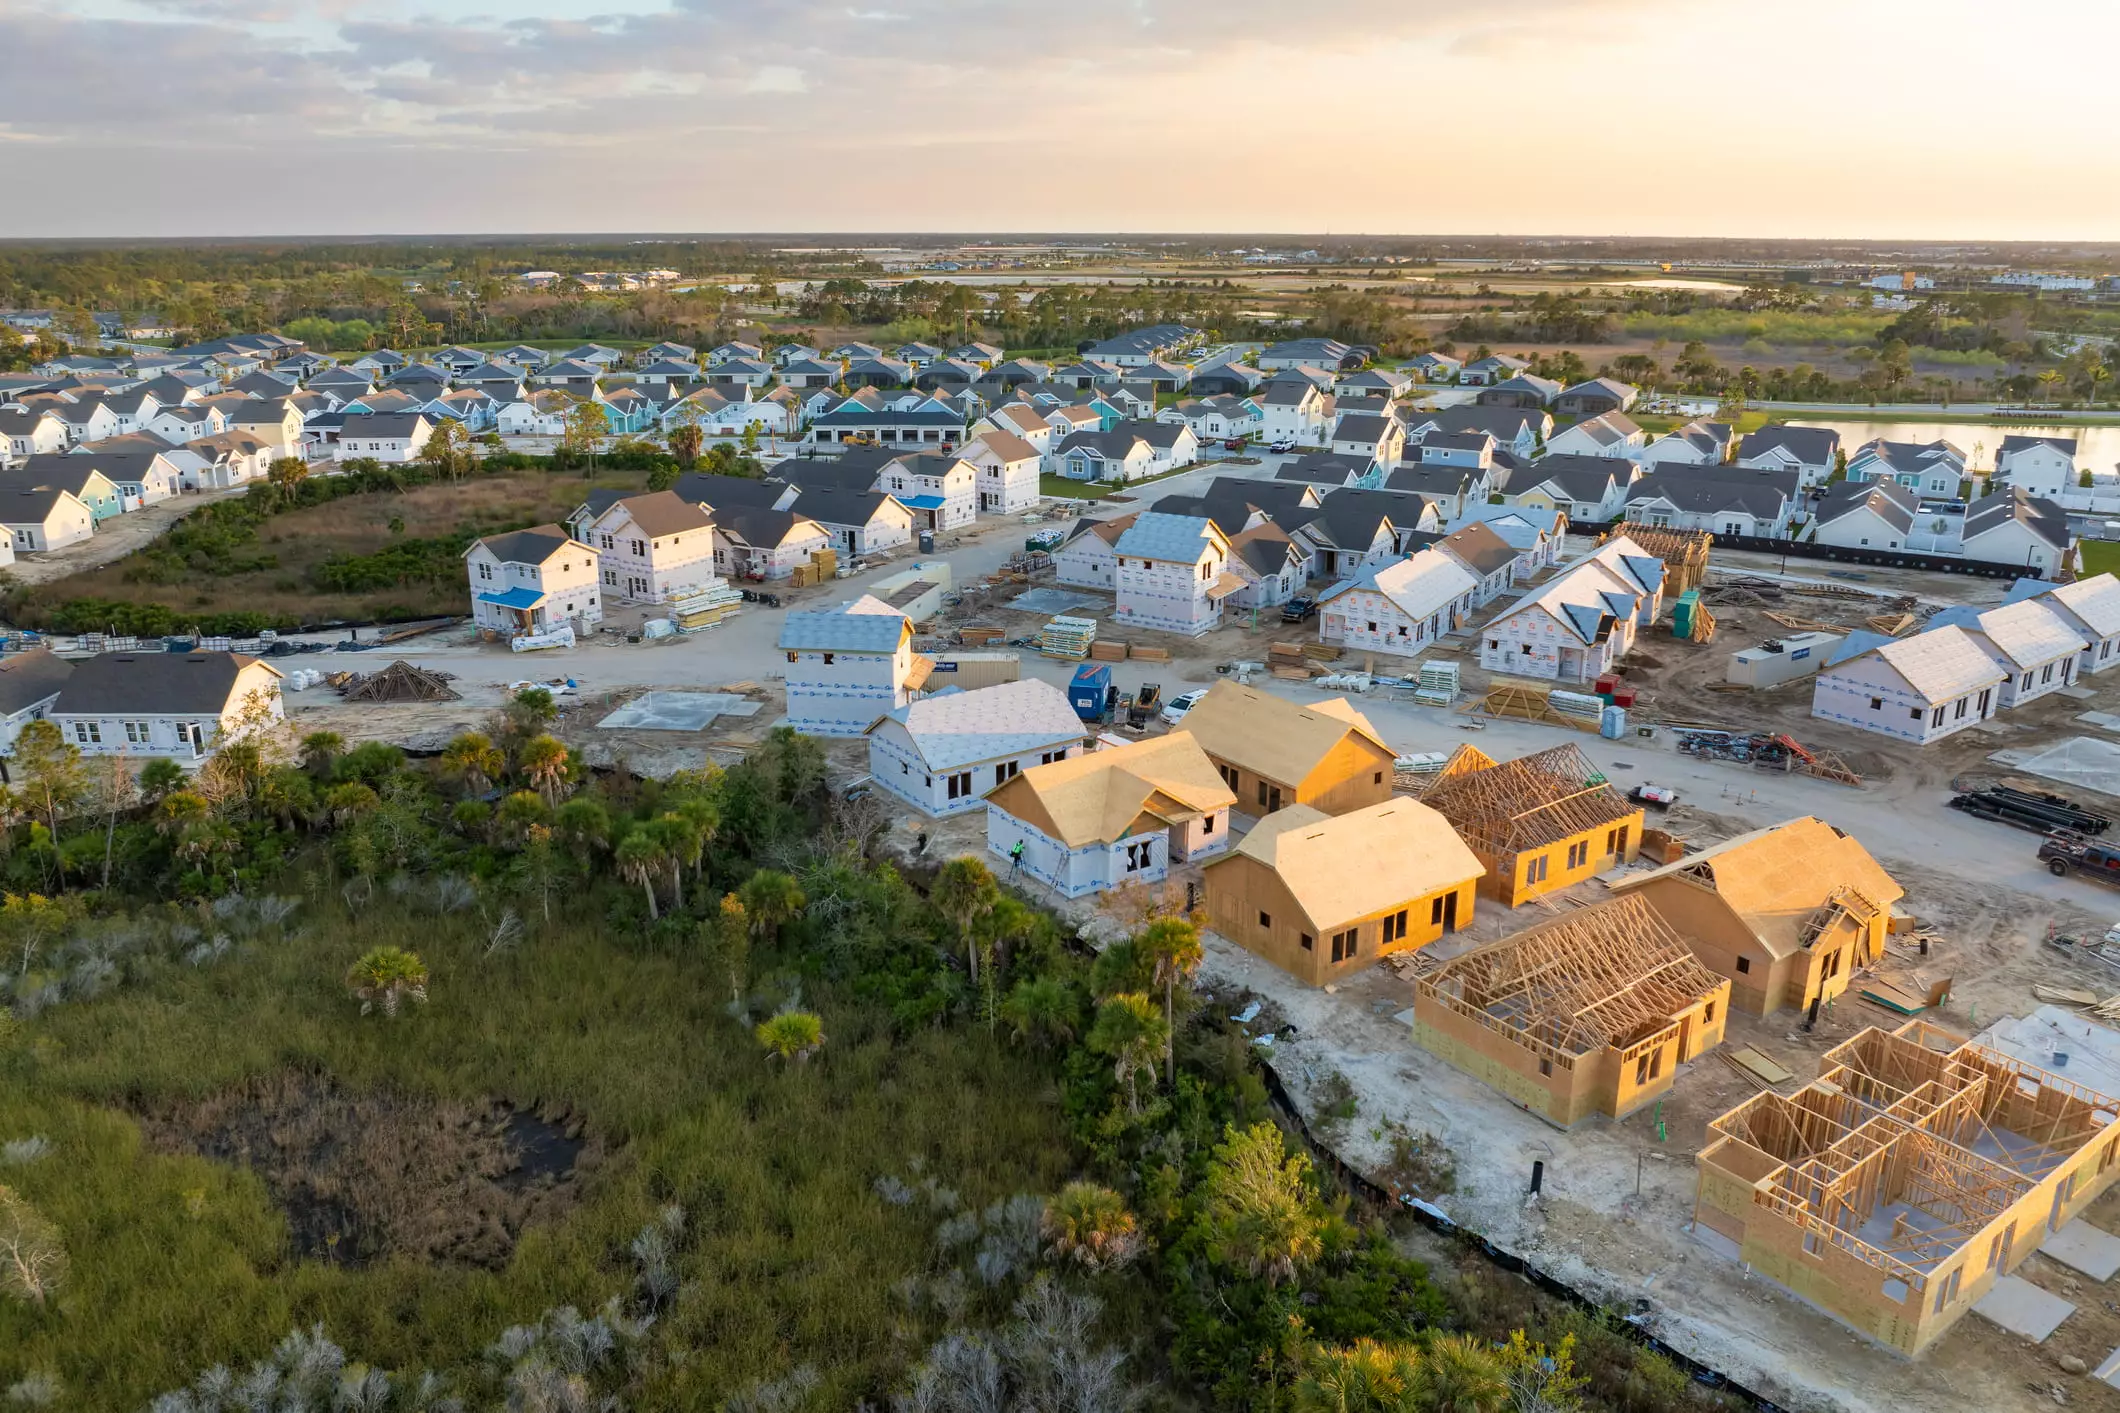
Home sizes vary widely across the U.S. Generally, you'll find the largest homes in the Mountain West and the South, while the smallest are concentrated in the Northeast and West Coast. Although exact rankings can shift slightly year-to-year, clear and consistent regional patterns emerge: states with abundant land, active new construction, and suburban growth tend to have larger houses, while those with high land costs, dense metropolitan areas, and older housing stock typically see smaller average home sizes.
- States With the Largest Average Home Sizes: The following states consistently rank at the top of lists comparing average home sizes in the U.S.:
- Utah
- Colorado
- Texas
- Georgia
- North Carolina
- Idaho
- Tennessee
- Arizona
- States With the Smallest Average Home Sizes: These typically include:
- New York
- California
- Hawaii
- Massachusetts
- Rhode Island
- New Jersey
- Maryland
The differences in minimum house size by state largely come down to three main factors:
- Availability and cost of land
- Age of housing stock
- Prevalence of high-density multi-family living
Basically, states that trend larger have plenty of land available for building, lower land costs, suburban expansion, high rates of new construction, and larger average household sizes. On the other hand, the states with smaller homes usually have limited buildable space, high-demand urban centers, competitive land markets, a greater presence of condos and multi-family buildings, and older homes built when standards were smaller.
A Comparative Table of Average Home Size by State
The table below provides a state-by-state comparison of typical average home sizes across the United States. It highlights how regional land availability, development patterns, and housing stock influence the amount of living space homeowners can expect in each state.
|
State |
Typical Average Home Size (Sq. Ft.) |
Regional Pattern |
|---|---|---|
|
Alabama |
2,000–2,200 |
Suburban growth, affordable land |
|
Alaska |
1,800–2,000 |
Remote development, mixed housing |
|
Arizona |
2,200–2,400 |
Sunbelt expansion, newer builds |
|
Arkansas |
1,800–2,000 |
Rural housing, moderate density |
|
California |
1,600–1,800 |
High land costs, dense metros |
|
Colorado |
2,400–2,600 |
New construction, higher incomes |
|
Connecticut |
2,100–2,300 |
Older homes, affluent suburbs |
|
Delaware |
2,200–2,400 |
Suburban development corridor |
|
Florida |
1,900–2,100 |
Condos, mixed single-family growth |
|
Georgia |
2,200–2,400 |
Expanding metro suburbs |
|
Hawaii |
1,500–1,700 |
Extreme land scarcity |
|
Idaho |
2,100–2,300 |
Rapid in-migration, new housing |
|
Illinois |
1,700–1,900 |
Older housing stock, urban centers |
|
Indiana |
1,900–2,100 |
Affordable land, suburban spread |
|
Iowa |
1,600–1,800 |
Rural housing dominance |
|
Kansas |
2,000–2,200 |
Low density, single-family homes |
|
Kentucky |
1,900–2,100 |
Mixed rural and suburban housing |
|
Louisiana |
1,900–2,100 |
Traditional single-family housing |
|
Maine |
1,600–1,800 |
Older homes, rural density |
|
Maryland |
1,800–2,000 |
Mixed urban/suburban development |
|
Massachusetts |
1,700–1,900 |
Older housing stock |
|
Michigan |
1,700–1,900 |
Legacy housing, slower growth |
|
Minnesota |
2,000–2,200 |
Suburban expansion, newer homes |
|
Mississippi |
2,000–2,200 |
Low land costs, larger lots |
|
Missouri |
1,800–2,000 |
Mixed urban and rural housing |
|
Montana |
2,100–2,300 |
Low density, newer construction |
|
Nebraska |
2,000–2,200 |
Single-family dominant market |
|
Nevada |
2,000–2,200 |
Planned communities, newer builds |
|
New Hampshire |
1,900–2,100 |
Suburban, limited urban density |
|
New Jersey |
1,700–1,900 |
Dense metros, zoning limits |
|
New Mexico |
2,000–2,200 |
Spread-out development |
|
New York |
1,600–1,800 |
Urban concentration |
|
North Carolina |
2,200–2,400 |
Strong new-build market |
|
North Dakota |
2,100–2,300 |
Low density, newer homes |
|
Ohio |
1,800–2,000 |
Older housing, mixed density |
|
Oklahoma |
1,900–2,100 |
Affordable land, suburban housing |
|
Oregon |
1,900–2,100 |
Urban growth boundaries |
|
Pennsylvania |
2,000–2,200 |
Older cities, suburban sprawl |
|
Rhode Island |
1,600–1,800 |
Older, compact homes |
|
South Carolina |
2,100–2,300 |
Coastal growth, new construction |
|
South Dakota |
1,900–2,100 |
Low density, rural housing |
|
Tennessee |
2,100–2,300 |
Moderate density, newer homes |
|
Texas |
2,300–2,500 |
Abundant land, suburban growth |
|
Utah |
2,500–2,700 |
Large, suburban-focused |
|
Vermont |
1,900–2,100 |
Rural housing, older stock |
|
Virginia |
2,000–2,200 |
Suburban growth near metros |
|
Washington |
2,100–2,300 |
High demand, mixed density |
|
West Virginia |
1,700–1,900 |
Older homes, rural focus |
|
Wisconsin |
1,800–2,000 |
Traditional Midwestern housing |
|
Wyoming |
2,200–2,400 |
Sparse population, larger homes |
Why Homes Are Bigger in Some States and Smaller in Others
Several factors drive the difference in average home size across the U.S. The key influences include:
- Land Availability and Cost: This is the single biggest driver of average home size in the U.S. States with more open (and relatively inexpensive) land, like Texas and Utah, can support the construction of bigger homes. On the other hand, in states where land is a premium commodity (like California or New Jersey), high costs force builders and buyers to prioritize efficiency and smaller footprints.
- Zoning and Development Regulations: Restrictive zoning in many coastal states limits the ability to build large single-family homes on large lots, thereby encouraging denser, smaller development. In contrast, more permissive zoning in the South and Mountain West generally facilitates sprawling subdivisions and larger homes.
- Age of Housing Stock: Older homes, typically built before 1950 when average family size was smaller and building standards were different, are usually smaller. These homes are more common in Northeastern states and often have limited options for expansion.
- Urban vs. Suburban Spread: Dense, urban areas generally prioritize smaller homes, apartments, condos and similar housing types, which lowers the average square footage. States with a strong culture of suburban living and room for outward expansion naturally feature larger, detached single-family homes.
- Dominance of Multi-Family vs. Single-Family Construction: In states like New York, a significant portion of new housing is in multi-family buildings (apartments, condos, etc.), which are inherently smaller. In states like Utah, the vast majority of new construction is detached single-family homes, boosting the state’s average home size.
- Household Demographics & Lifestyle: Metro cities with more singles and couples typically have smaller average homes compared to areas with more children and multigenerational households, where there is higher demand for space.
- Remote Work & Space Prioritization: More people working from home want dedicated offices, flexible bedrooms, and living spaces. States with strong inward migration reflecting this trend often see higher demand for larger homes.
- Income Levels: Higher incomes can generally support larger homes, though this correlation can be offset or complicated by extremely high land costs in expensive coastal markets.
It is worth noting that the average home size in the U.S. has shifted dramatically over the past century. For decades, the trend was simple: homes got bigger. In the 1940s, new homes averaged just over 1,000 square feet. By 2015, that figure had ballooned to nearly 2,700 square feet, with open floor plans, walk-in closets, and multi-car garages becoming standard. However, since then, sizes have edged downwards, and homes are now getting slightly smaller. This represents a shift from the “more for less” trend, with many buyers today prioritizing functionality over size. Rising construction costs, high mortgage rates, smaller households, land scarcity, and a growing preference for efficiency and “right-sizing” have all contributed to this reversal.
Notwithstanding this shift, there is often still a significant gap between the home size buyers prefer and the home size they can afford. Surveys frequently show that many Americans would like slightly more space than they currently have. However, affordability gaps mean that most buyers are forced to balance location, layout efficiency, and budget against their ideal home size. This gap between aspiration and economic reality is a key factor shaping the actual average home sizes we see today.
To summarize, there is no single “standard” home size in the U.S.; it depends entirely on where you live. What feels spacious in one region may seem modest in another, shaped by local expectations and norms. However, the logic is simple: where land is plentiful and cheap, homes sprawl; where land is scarce and expensive, homes grow vertically and become more compact.
The recent shift toward slightly smaller homes signals a new chapter, one where practicality and affordability are beginning to outweigh the pursuit of pure square footage. Whether you’re buying, selling, renting, downsizing, or investing, the key is to focus on how well a home fits your needs, not just the number of square feet it offers. Understand this: the right home is not always the largest, it’s the one that supports the life you want to build.

Elena Novak leads real estate research and analysis at PropertyChecker.com, where she digs into housing trends, tracks property data, and unpacks investment strategies across the U.S. With a background in flipping homes and a degree in Business and Real Estate Development, she brings a practical, hands-on approach to market analysis. Elena is especially skilled at uncovering hidden property value and guiding both homeowners and investors through shifting market conditions. She's also passionate about sustainable design and smart home innovation. When she's not analyzing the market, she's probably knee-deep in a DIY project, scouting vintage décor, or building something new in her workshop.